Data Interpretation Bar Graphs|Data Interpretation Bar Chart|Bar Chart
Preparation for Interview Aptitude on Data Interpretation Bar Chart|Data Interpretation Bar Graphs
Preparation for government exams on Data Interpretation Bar Chart|Data Interpretation Bar Graphs
Preparation for MBA exams on Data Interpretation Bar Chart|Data Interpretation Bar Graphs
Data Interpretation Bar Graphs SET-1
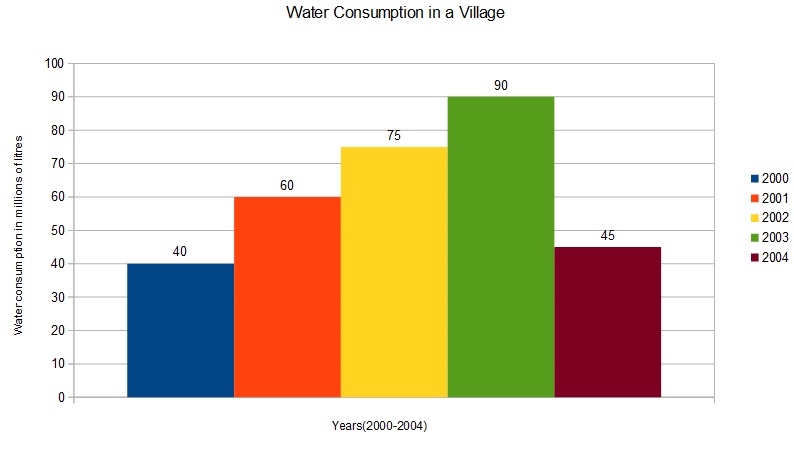
The Graph shows the consumption of water in a village between years 2000 to 2004 in millions of litres .Please answer the questions below.
Q1 . What is the conumption of water in 2003 as compared to the total consumption across years?
1. 30 %
2. 33%
3. 35.04%
4. 29.03 %
Correct Answer is
29.03 %
SOLUTION
the water consumption in 2003 is 90
the consumption in all the other years=40+60+75+90+45=
310
percentage=90/310
=29.03%
Q2 . What is the highest increase in percentage of water consumption?
1. 50%
2. 33.33%
3. 25%
4. 20%
Correct Answer is
50%
SOLUTION
First eliminate choices
2003-2004 is not the answer as the percentage is decreased
From the other years pick the correct choice
In the year 2001 the increase is 60-40/40x100
=50%
Q3 . What is the percentage decrease in the water consumption from 2003 to 2004?
1. 55%
2. 33.33%
3. 25%
4. 50%
Correct Answer is
50%
SOLUTION
2003 consumption is 90
2004 consumption is 45
percentage is
90-45/90x100
=50 % Decrease
Q4 . Which year has the highest decrease in percentage?
1. 2003-2004
2. 2001-2002
3. 2000-2001
4. 2002-2003
Correct Answer is
2003-2004
SOLUTION
No need to solve
look at the graph only one year has a decrease in percentage.
Q5 . What is the percentage change in water consumption in 2001 to 2002?
1. 50% increase
2. 25 % increase
3. 25% decrease
4. 20% decrease
Correct Answer is
25 % increase
SOLUTION
Consumption in 2001 was 60
Consumption in 2002 was 75
Increase=75-60/60x100=
25 % Increase
You are Currently reading
For more Data Interpretation Bar Graph problems
Correct Answer is
29.03 %
SOLUTION
the water consumption in 2003 is 90
the consumption in all the other years=40+60+75+90+45=
310
percentage=90/310
=29.03%
1. 50%
2. 33.33%
3. 25%
4. 20%
Correct Answer is
50%
SOLUTION
First eliminate choices
2003-2004 is not the answer as the percentage is decreased
From the other years pick the correct choice
In the year 2001 the increase is 60-40/40x100
=50%
Q3 . What is the percentage decrease in the water consumption from 2003 to 2004?
1. 55%
2. 33.33%
3. 25%
4. 50%
Correct Answer is
50%
SOLUTION
2003 consumption is 90
2004 consumption is 45
percentage is
90-45/90x100
=50 % Decrease
Q4 . Which year has the highest decrease in percentage?
1. 2003-2004
2. 2001-2002
3. 2000-2001
4. 2002-2003
Correct Answer is
2003-2004
SOLUTION
No need to solve
look at the graph only one year has a decrease in percentage.
Q5 . What is the percentage change in water consumption in 2001 to 2002?
1. 50% increase
2. 25 % increase
3. 25% decrease
4. 20% decrease
Correct Answer is
25 % increase
SOLUTION
Consumption in 2001 was 60
Consumption in 2002 was 75
Increase=75-60/60x100=
25 % Increase
You are Currently reading
For more Data Interpretation Bar Graph problems
Correct Answer is
50%
SOLUTION
2003 consumption is 90
2004 consumption is 45
percentage is
90-45/90x100
=50 % Decrease
1. 2003-2004
2. 2001-2002
3. 2000-2001
4. 2002-2003